 GeoData.NZ
ROSS ISLAND
Type of resources
Available actions
Topics
Keywords
Contact for the resource
Provided by
Years
Update frequencies
status
-
Ultraviolet radiation measurements over the spectral region 290-450 nm with a high precision spectro-radiometer. The spectro-radiometer was installed at Arrival Heights as a two month (November 2006 – January 2007) blind inter-comparison with the established measurement programme run by Biospherical Instruments for the USAP. The data was compared with the USAP data taken simultaneously. These data are held internally by NIWA. GET DATA: contact dan.smale@niwa.co.nz
-
Measurements of chlorine monoxide (ClO) made with a Microwave Chlorine Monoxide Millimeter Wave Spectrometer (ground-based). The instrument (ClOe1) was established in January of 1996 at Scott Base and decommissioned in October 2023. A replacement radiometer (ClOe4) was installed at Scott Base in February 2023 (an overlap in the data for timeseries continuity purposes). These data are produced in collaboration with State University of New York (SUNY) Stoney Brook and Naval Research Laboratory (NRL). “Raw” data are times and recorded microwave emission spectra. “Derived” data are column amounts and vertical profile information of chlorine monoxide (ClO). The instrument has acquired the nickname "CloeTechnique" for vertical profile information uses "optimal estimation" to extract information from pressure broadening of ClO emission line. Significant failure in early 2018 only fixed in November 2018. No data in the July - October 2018 period. Data is held at NRL and in the NDACC database. Data are available as monthly .ndm files, and additional metadata are available in the header. Instrument timeline: - ClOe1 1996-2023 - ClOe4 2023 – present GET DATA: https://www-air.larc.nasa.gov/missions/ndacc/data.html?station=scott.base#
-
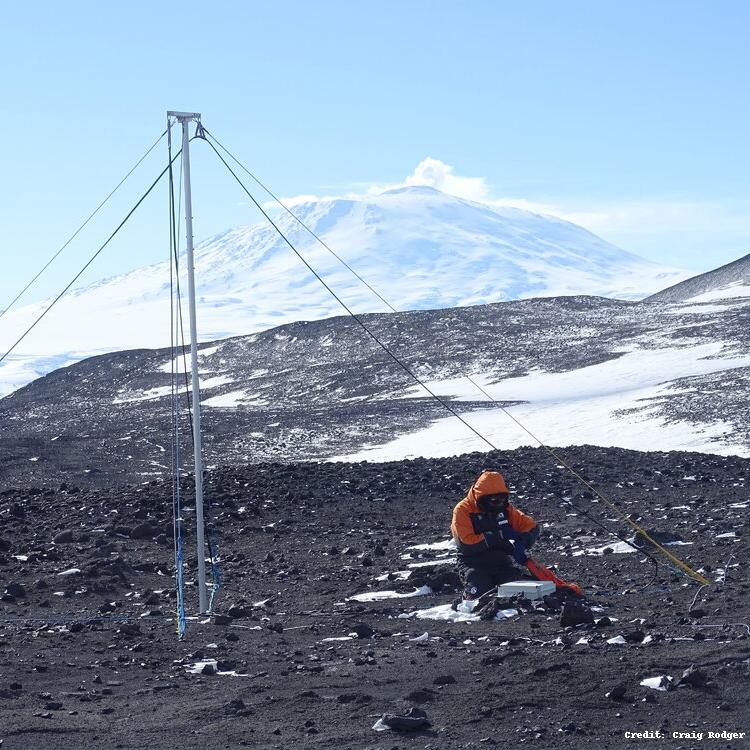
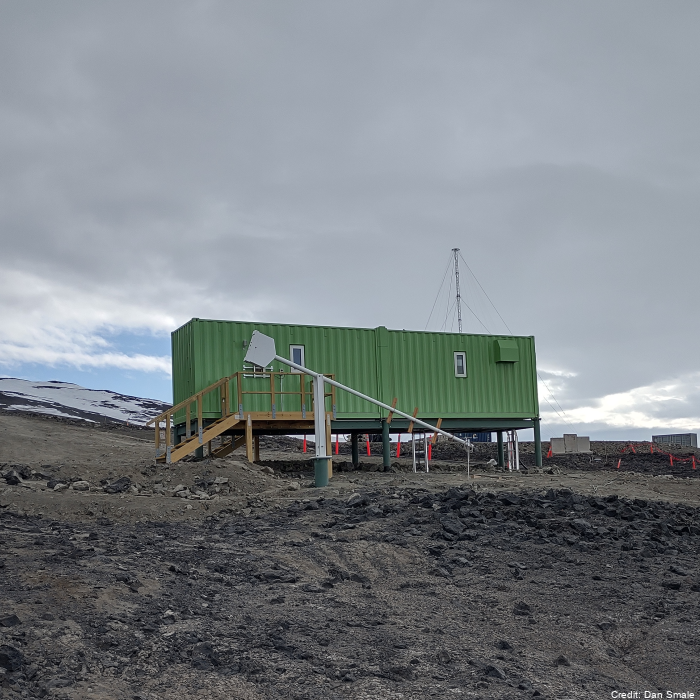
The WWLLN Very Low Frequency (VLF) Radio Sensor was installed at Scott Base in November 2015 by Dr. James Brundell and Ms. Emma Douma as part of Antarctica New Zealand Event K060-1516-A. The sensor measures the electric field in the Very Low Frequency radio range (~500 Hz-50 kHz) and passes it to a PC which processes the data for the experiments. The antenna is located behind the Hatherton lab. It was installed due to increasing manmade electromagnetic noise levels in the "quiet zone" at Arrival Heights. The observations from this antenna are now the primary WWLLN feed from Ross Island, the Arrival Height's magnetic field antenna is now a backup. WWLLN, uses the VLF feed but processes it to detect the radio-wave pulses from lightning. WWLLN observations are sent to a central processing computer to determine the time and location of lightning pulses all over the globe. The World Wide Lightning Location Network (WWLLN) is an experimental Very Low Frequency (VLF) network of sensors being developed through collaborations with research institutions across the globe. The network exploits the considerable electromagnetic power radiated by lightning as "sferics" present in the VLF band. By combining radio-pulse observations from at least 5 stations, the WWLLN central processing computers can determine the location of the original lightning discharge. As the radio-pulse observations are immediately sent back across the internet to the central processing computers locations are generated within ~10 s of the discharge, and thus near real time. There are currently about 70 active VLF receiving stations operating in the VLF World-Wide Lightning Location Network, including the Scott Base measurements. WWLLN observations are continuously transmitted to one of the WWLLN primary servers, in this case flash.ess.washington.edu at the University of Washington, Seattle, USA. GET DATA: https://space.physics.otago.ac.nz/aarddvark/
-
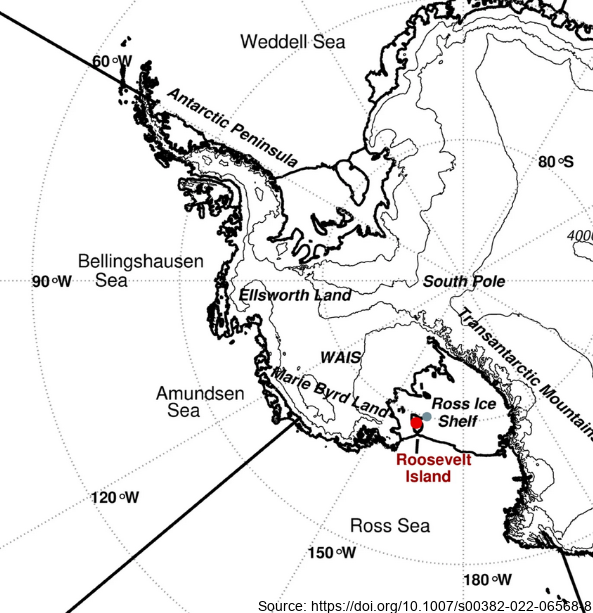
Here we examine the water stable-isotope data from the Roosevelt Island Climate Evolution (RICE) ice core. In this study, we use empirical orthogonal function (EOF) analysis to investigate the relationship between RICE ice-core oxygen-18 isotopes (δ18O) and Southern Hemisphere atmospheric circulation during the extended austral winter (April–November). - Deep Location: 79.364°S, 161.706°W, elevation 550 m a.s.l. - 12/13B Location: 79.362°S, 161.698°W, elevation 550 m a.s.l. - Core depth 763 m. Depth interval provided here: 1.29 to 38.56 m - txt data file, NaN = no data Further details are available at https://doi.org/10.1007/s00382-022-06568-8 GET DATA: https://github.com/demanuelsson/ClimDyn_2022_Matlab/tree/main/data
-
Aerial reconnaissance and photography are used in the Ross Sea sector of Antarctica to determine the breeding locations of Adélie penguins and to count the numbers of nests occupied during the early incubation period. From 1981 to present (two-year embargo), all islands and sea coasts between 158°E and 175°E have been searched, and 11 previously unreported breeding colonies discovered. The aim is to census Adélie (Pygoscelis adeliae) populations to provide basic data against which future population levels can be compared in order to monitor environmental change of the Antarctic Ocean ecosystem, both natural and man-induced. GET DATA: https://datastore.landcareresearch.co.nz/en_AU/dataset/adelie-penguin-census-data
-
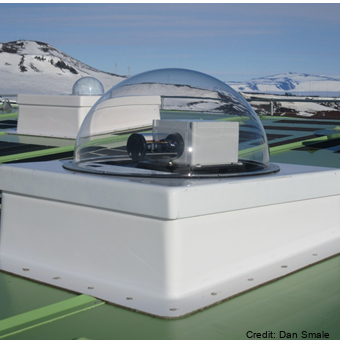
Spectroscopic measurements of stratospheric gases Nitrogen Dioxide (NO2), Chlorine Dioxide (OCIO), Bromine Oxide (BrO) and Ozone (O3) using scattered sunlight. Airyx and Envimeas: A dual MAX-DOAS UV/visible wavelength diode array spectrometer is deployed to measure of ozone (O3), nitrogen dioxide (NO2), chlorine dioxide (OClO) and bromine oxide (BrO). The instrument is a similar instrument to that of EnviMeas, and produces overlapping datasets with ADAS-2. Fixed azimuth direction, same as the Antarctic Diode Array spectrometer. System 2 (ADAS-2). The data are currently being held internally by NIWA. “Raw” data are times and recorded spectra of scattered light for several viewing directions. “Derived” data are column amount of NO2, OClO, BrO and O3, which can be split into tropospheric and stratospheric parts. This technique is sometimes referred to as MAX-DOAS Multiple-Axis Dual Optical Absorption Spectrometry. This work is carried out in collaboration the University of Heidelberg. ADAS2, Envimeas and Airyx measurements: UV/visible Multi-Axis Differential Optical Absorption Spectroscopy (MAX-DOAS) diode array spectrometers making measurements of ozone (O3), nitrogen dioxide (NO2), chlorine dioxide (OClO) and bromine oxide (BrO). JY: A scanning grating UV/Vis monochromator taking measurements of total slant column of NO2 and Ozone using scattered zenith sunlight. ADAS: A CCD grating UV/Vis grating Acton spectrometer making measurements of total slant column NO2, BrO, OClO and ozone made using scattered light zenith sunlight. Pandora: Direct sun UV/Vis measurements of ozone and NO2. Campaign to test feasibility of long term deployment at Arrival Heights. Instrument timeline JY: 1982 -2023 ADAS: 1993 - 2017 ADAS2: 1998 - present Pandora: 2015 Aug – Oct. Airyx & Envimeas : 2018 – present O3, OCIO and BrO data are in the process of being archived - please contact Richard Querel for data access. NO2 data is available via the "GET DATA" link. GET DATA: https://www-air.larc.nasa.gov/missions/ndacc/data.html?station=arrival.heights
-
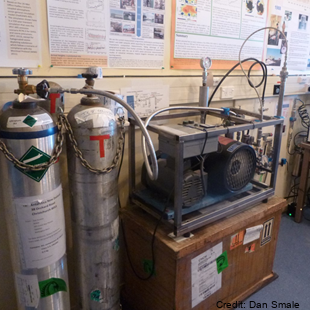
Gas samples (CO2, CH4, CO, N2O, 13CO2, 14CH4, 13CO, C18O, 14CO) are collected from an inlet atop of a mast 5 metres above ground level in North sector wind conditions. Flasks and cylinders are analysed back at NIWA Greta point Gaslab. The sampling was established in November 1989. Samples are only taken when wind is from the Northerly sector and above 5kts. High pressure cylinders: ~1600psi in 30 litre cylinders and low-pressure flask samples taken (~5 litres, 25 psi in 2 litre flask). Air samples in the Cylinders & Flasks shipped to New Zealand regularly. Analysis performed at NIWA's GASLAB located at Greta Point Wellington. Analysis by Gas chromatography (GC) and isotope ratio mass spectrometry (IRMS). A semi-automated flask sampling system was installed in February 2017, allowing extra flask samples with minimal operator intervention. GET DATA: Contact Gordon Brailsford (g.brailsford@niwa.co.nz)
-
Measurements of total column of ozone made with Dobson spectrophotometer that measures either direct or zenith scattered ultraviolet light. The instrument was established in September of 1989 at 77° 49.8'S, 166° 39.6'E. Additionally a Brewer spectrophotometer took total column ozone measurements at Scott from 1989 to 1996. From 1989 to 2006 the Dobson (ID 17) was operated in manual mode but had an electronic encoder and computer added in 2006 for recording measurements. The data acquisition system was upgraded in Febuerary 2015 at Lauder, NZ. It is now running the JMA automation system. The Dobson (instrument ID: D17) is shipped out for maintenance and intercomparison with regional standard Dobson in Melbourne approximately every 5 years. Data (for both Dobson and Brewer) is held internally by NIWA and in the NDACC database. Data is also archived in the ozone and UV data centre Toronto, “Raw” data are times and instrument settings for instrument readings. “Derived” data are column amounts of ozone. Time line: Dobson 1987 -present Brewer 1989-1996 GET DATA: https://www-air.larc.nasa.gov/missions/ndacc/data.html?station=arrival.heights#
-
Here, we present a decadally resolved record of sea-salt sodium (a proxy for open-ocean area) and non-sea salt calcium (a proxy for continental dust) from the well-dated Roosevelt Island Climate Evolution (RICE) core, focusing on the time period between 40–26 ka BP. Drilling site coordinates: (79.364° S, 161.706°W). Further collection details can be found at https://doi.org/10.1038/s41467-023-40951-1
-
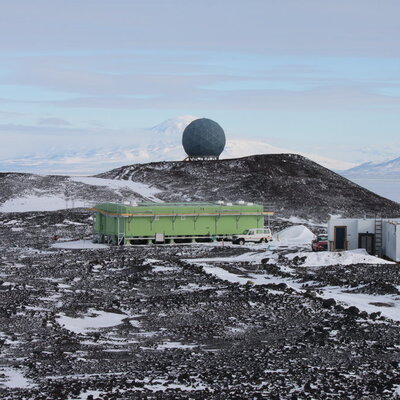
Our studies investigate the Antarctic middle atmosphere’s response to natural and man-made factors which change climate. The dynamical processes of this region are significant in controlling the circulation at lower altitudes, including the stratospheric ozone layer. The feedbacks in the atmosphere, couple this change to climate change at the surface. The seasonal behaviour of this wave-driven circulation, particularly its dependence on major disturbances in the stratosphere which result in the transport of energy and momentum by waves to higher altitudes are examined. The programme is based on continuous monitoring of winds in the middle atmosphere at altitudes of 60-100km using a ground-based medium frequency radar located at Scott Base. The Scott Base radar has been recording wind measurements since 1982 and is one of the longest duration climate records of this type of data in the world. The measurements made by the Scott Base MF radar provide valuable climate information about how the flow in the middle atmosphere (70-100 km) has changed. This record along with observations from satellite instruments allows the coupling between the middle atmosphere and the surface over Antarctica to be examined, this coupling is often associated with wave-like motions in the atmosphere that the MF radar is particularly good at observing. The circulation is dominated by pole-to-pole flow, from the summer pole to the winter pole. This circulation is largely driven by atmospheric waves with time scales from 15 minutes to 15 days. The large scale of the phenomenon benefits considerably from co-operative observations by our own radar near Christchurch, and by our US colleagues at the South Pole, Admiral Heights (from January 2000) and Tekapo. We also use satellite data for the region between Antarctica and New Zealand. This type of study is important because improvements in the predictive ability of the current generation of climate models may be particularly sensitive to the coupling processes that we examine.